
In the era of big data, organizations are inundated with vast amounts of raw data every day. This data, while abundant, often lacks the structure and clarity needed to derive meaningful insights. The journey from raw data to quality information is a critical process that can unlock significant value for businesses.
The Importance of Data Quality
Data quality is the foundation of any data-driven decision-making process. High-quality data leads to accurate analyses, reliable insights, and informed decisions. On the other hand, poor data quality can lead to misguided strategies, operational inefficiencies, and even financial losses.
Understanding Raw Data
Raw data is unprocessed and unstructured data collected from various sources. It could be anything from user-generated content on social media platforms to transactional data from sales. While raw data is rich in potential insights, its unstructured nature makes it challenging to analyze and interpret.
The Journey to Quality Information
Transforming raw data into quality information involves several steps:
1. Data Collection:
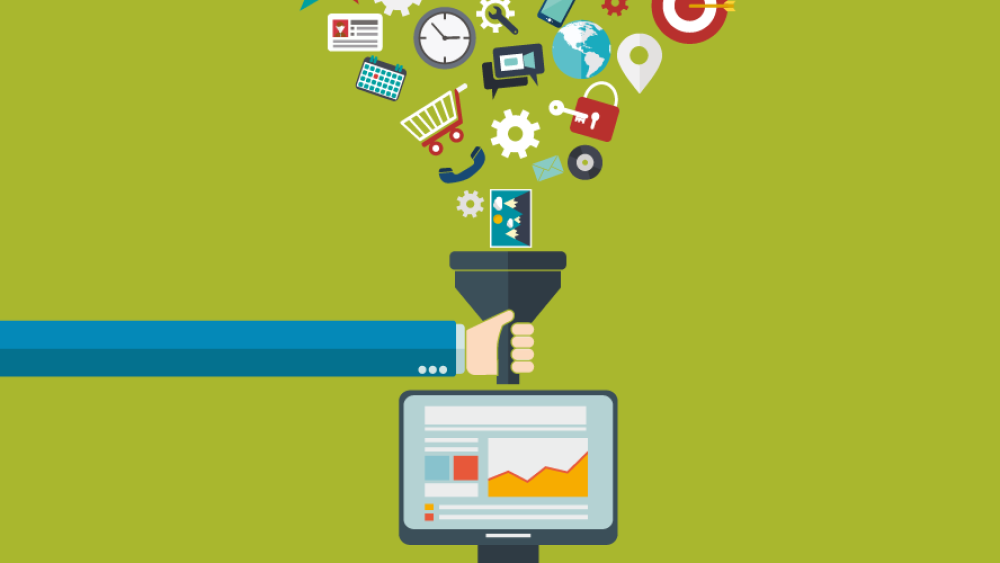
Data collection is the first step in the journey from raw data to quality information. It involves gathering raw data from relevant sources that can provide valuable insights for the business problem or goal. Some examples of data sources are:
- Web scraping: Extracting data from websites using automated scripts or tools. This can be useful for collecting data on competitors, customers, or market trends.
- API calls: Accessing data from online platforms or services using application programming interfaces (APIs). This can be useful for collecting data on social media, weather, or news.
- Direct user input: Collecting data from users through surveys, feedback forms, or online interactions. This can be useful for collecting data on user preferences, behavior, or satisfaction.
2. Data Cleaning:
Data cleaning is the second step in the journey from raw data to quality information1. It involves removing or correcting any errors, inconsistencies, or anomalies in the raw data2. Some examples of data cleaning tasks are:
- Removing duplicates: Identifying and deleting any records that are repeated or redundant in the data set.
- Correcting errors: Detecting and fixing any typos, spelling mistakes, or formatting issues in the data values.
- Dealing with missing values: Handling any data values that are null, empty, or unknown. This could involve deleting, imputing, or ignoring them.
3. Data Transformation:
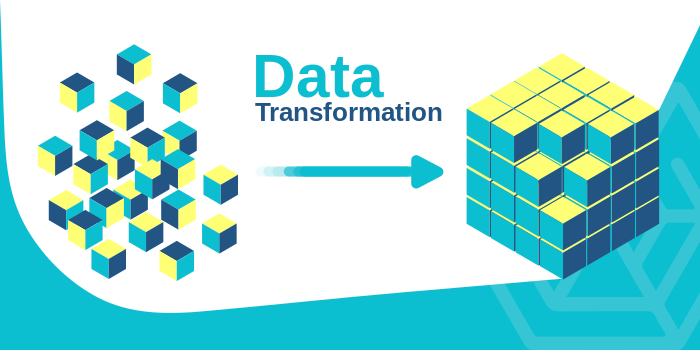
Data transformation is the third step in the journey from raw data to quality information1. It involves converting the data into a more suitable format for analysis. Some examples of data transformation tasks are:
- Normalization: Scaling the data values to a common range, such as 0 to 1 or -1 to 1. This can help reduce the impact of outliers and improve the performance of some algorithms.
- Aggregation: Combining the data values into groups or categories, such as sum, average, or count. This can help simplify the data and reveal patterns or trends.
- Preprocessing: Applying other techniques to enhance the data quality, such as encoding, imputation, or feature extraction. This can help deal with categorical, missing, or complex data.
4. Data Analysis:
Data analysis is the fourth step in the journey from raw data to quality information1. It involves deriving insights from the data using statistical methods or machine learning algorithms. Some examples of data analysis tasks are:
- Descriptive analysis: Summarizing the main features of the data, such as mean, median, mode, standard deviation, frequency, or distribution. This can help understand the basic characteristics of the data.
- Exploratory analysis: Finding patterns, trends, correlations, or outliers in the data. This can help generate hypotheses or questions for further investigation.
- Inferential analysis: Testing hypotheses or making predictions based on the data. This can help draw conclusions or make decisions based on evidence.
- Prescriptive analysis: Recommending actions or solutions based on the data. This can help optimize outcomes or achieve goals based on constraints.
5. Information Presentation:
Information presentation is the fifth and final step in the journey from raw data to quality information. It involves displaying the insights derived from the data analysis in an understandable and appealing format1. Some examples of information presentation methods are:
- Visual dashboard: Creating a graphical interface that shows key metrics, trends, or comparisons using charts, graphs, or maps. This can help users quickly grasp the main findings and explore the data interactively.
- Written report: Writing a document that summarizes the data analysis process, results, and recommendations using text, tables, or images. This can help users understand the details and rationale behind the insights and actions.
- Automated alert: Sending a notification or message to users when a certain condition or threshold is met in the data. This can help users stay updated and respond timely to changes or opportunities.
The journey from raw data to quality information is not an easy one. It requires careful planning, rigorous execution, and constant monitoring. However, the rewards of this journey are well worth the effort. By transforming raw data into quality information, organizations can make better decisions, improve their operations, and ultimately drive their success.
If you are looking for a reliable and professional partner to help you transform your raw data into quality information, you should consider NetlinkSC. NetlinkSC is a company that specializes in data quality management, offering services such as data collection, cleaning, transformation, analysis, and presentation. NetlinkSC has a team of IT experts and specialized tools to ensure the highest standards of data quality for your business. Visit their website to learn more about their services and contact them today.